Ethereum (ETH) is currently trading at $3,300, marking a 10% drop over the past two days after failing to surpass the critical resistance level of $3,700. This decline has pushed ETH to test the $3,200 support zone, which remains vital for preventing further downward momentum.
Prominent crypto analyst Ali, in a recent post, suggests that a dip to $2,900 could signal a strong bullish opportunity for Ethereum. This level might present an attractive "buy-the-dip" scenario for investors. Looking ahead, the $4,100 resistance zone serves as a pivotal point.

A successful breakout above this neckline could trigger a significant rally, with the potential to push ETH toward the $6,500–$7,000 range, based on the height of the observed price pattern.
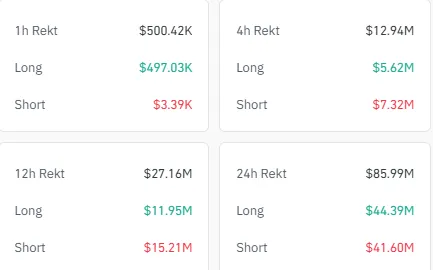
The past 24 hours have been marked by high liquidation activity, with a total of $85.99 million liquidated across the market. Long positions accounted for $44.39 million, reflecting increased selling pressure. At the same time, $41.60 million in short positions were also liquidated, highlighting extreme market volatility impacting traders on both sides.

Ethereum’s price action could take a bullish turn if it successfully forms an inverse head-and-shoulders (H&S) pattern, potentially driving the price up to $4,000. This breakout could pave the way for a new all-time high near $4,800. Historically, Ethereum has performed exceptionally well in the first quarter, adding weight to this optimistic scenario.
On the flip side, a potential triple-top pattern near $4,100 poses a bearish risk. This formation, identified by three peaks and a neckline around $2,150, could signal a significant downturn if Ethereum fails to maintain its current support levels. A drop to $2,150 would likely trigger a larger decline from its present price point.

Lokesh Gupta is a seasoned financial expert with 23 years of experience in Forex, Comex, NSE, MCX, NCDEX, and cryptocurrency markets. Investors have trusted his technical analysis skills so they may negotiate market swings and make wise investment selections. Lokesh merges his deep understanding of the market with his enthusiasm for teaching in his role as Content & Research Lead, producing informative pieces that give investors a leg up. In both conventional and cryptocurrency markets, he is a reliable adviser because of his strategic direction and ability to examine intricate market movements. Dedicated to study, market analysis, and investor education, Lokesh keeps abreast of the always-changing financial scene. His accurate and well-researched observations provide traders and investors with the tools they need to thrive in ever-changing market conditions.