Since hitting $264 on November 22, the price of SOL has been trending downward, shedding 33.50% of its value. By December 20, it reached a low of $175, entering a consolidation phase. The daily chart highlights that the $175 zone has historically been a key horizontal support level, previously acting as resistance.
Currently, SOL's price is struggling to break through the descending channel's resistance near $210. A successful breakout could push Solana's price toward $260, nearing its all-time high (ATH) of $265.
On-chain data reveals that PumpFun recently deposited 63,171 SOL (worth $13.11 million) into the Kraken exchange. This activity coincided with SOL's price rebounding above $200 for the first time since mid-December, signaling potential bullish momentum.
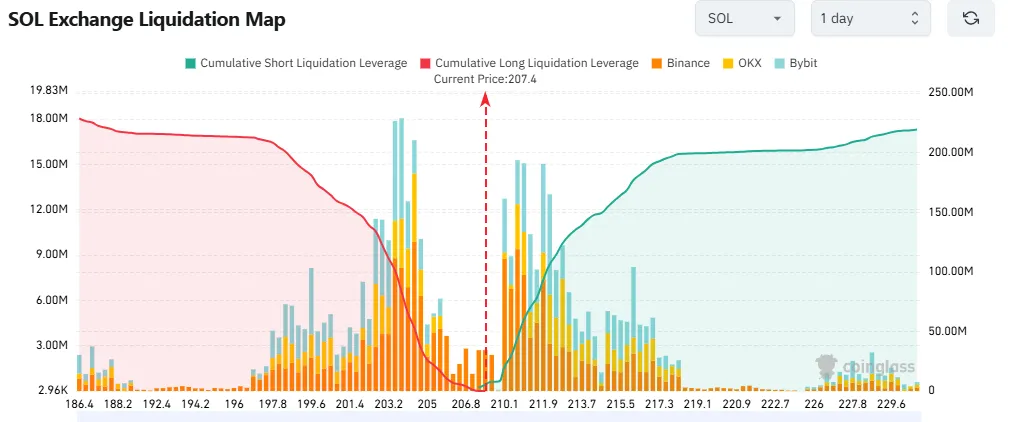
The Solana Exchange Liquidation Map highlights crucial price levels at $203.80 on the downside and $210.70 on the upside. These levels indicate a highly leveraged market, offering notable liquidation opportunities
A price increase to $210.70 could trigger the liquidation of around $44.76 million in short positions. On the other hand, a drop to $203.80 may result in the liquidation of approximately $83.38 million in long positions.
 Solana Open Interest And Liquidations
 Solana Futures Open Interest has climbed by 0.97% to reach $5.24 billion, signaling heightened market engagement. Meanwhile, trading volume has jumped by an impressive 15.12%, showcasing a notable increase in activity and liquidity within the SOL futures market.
Recent market data shows that SOL traders have liquidated $446.72K in short positions out of a total $641K in liquidations over the past four hours. This reflects strong bullish momentum in the market, with the possibility of more short liquidations on the horizon.


Lokesh Gupta is a seasoned financial expert with 23 years of experience in Forex, Comex, NSE, MCX, NCDEX, and cryptocurrency markets. Investors have trusted his technical analysis skills so they may negotiate market swings and make wise investment selections. Lokesh merges his deep understanding of the market with his enthusiasm for teaching in his role as Content & Research Lead, producing informative pieces that give investors a leg up. In both conventional and cryptocurrency markets, he is a reliable adviser because of his strategic direction and ability to examine intricate market movements. Dedicated to study, market analysis, and investor education, Lokesh keeps abreast of the always-changing financial scene. His accurate and well-researched observations provide traders and investors with the tools they need to thrive in ever-changing market conditions.