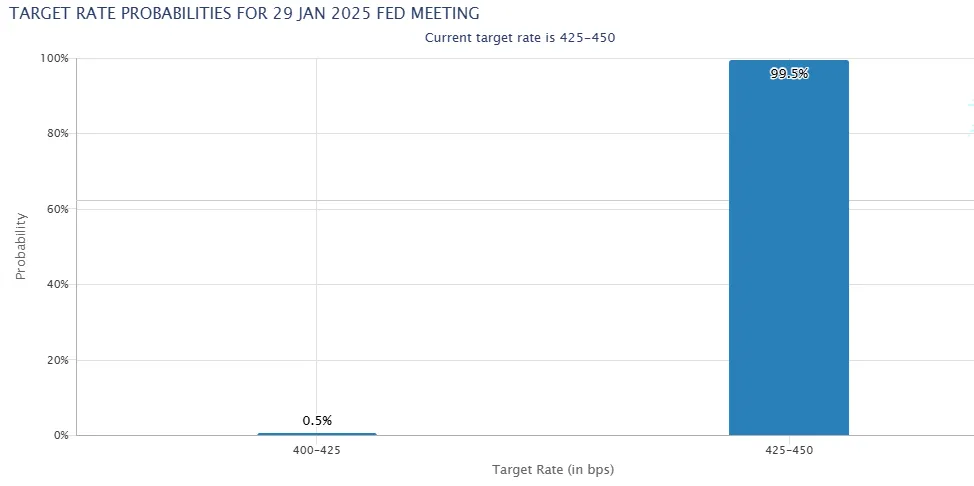
The market's sharp drop ahead of the FOMC meeting raises suspicions of manipulation. With the Fed expected to keep rates steady at 4.25%-4.5%, the CME FedWatch Tool shows a 97.3% probability of no change. However, if the Federal Reserve signals a dovish stance tomorrow, $BTC could see a significant rally.
Investors are betting on the possibility of looser monetary policy, and if that’s the signal the Fed sends, crypto markets might respond positively. It’s a high-stakes moment, as traders closely watch for any clues on future rate hikes or cuts.

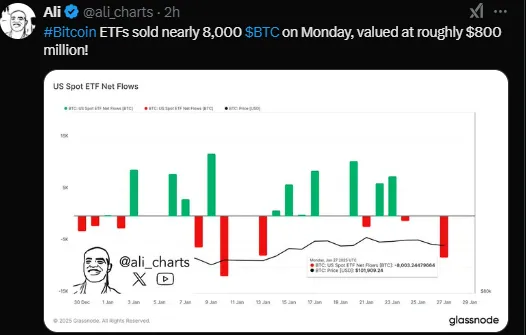
However, Analyst Ali Martinez pointed out that investors are withdrawing funds ahead of the FOMC meeting, with Bitcoin ETFs recently selling nearly 8,000 BTC, valued at $800 million. Market participants are adopting a cautious stance, awaiting U.S. Fed Chairman Jerome Powell's speech today.

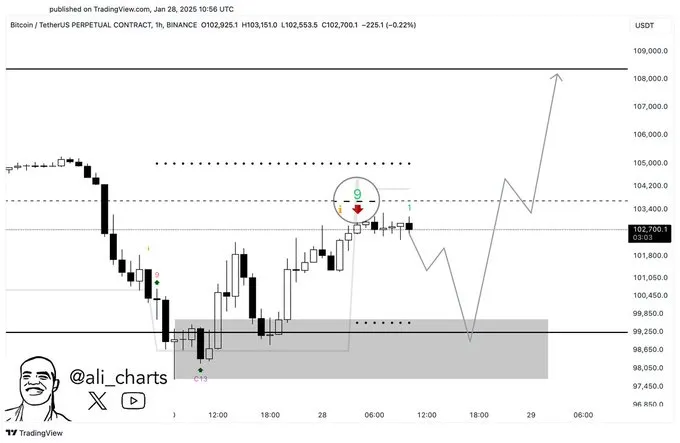
As per Ali Martinez, the TD Sequential indicator is signaling a potential sell on the hourly chart, indicating that #Bitcoin ($BTC) could revisit recent lows near $99,000. However, a rebound might occur, bolstered by a dovish outlook from the Fed tomorrow.

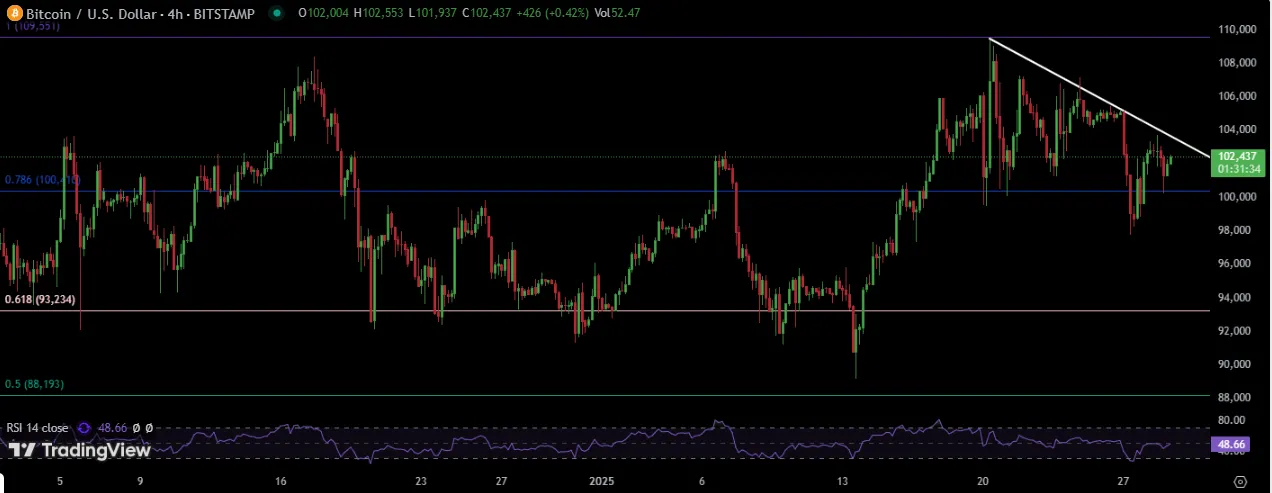
As per Rekt Capital, Bitcoin is currently forming an early-stage Higher Low while simultaneously experiencing short-term Lower Highs, creating a pennant-like market structure. This pattern is developing within the $101k-$106k range, a price zone where BTC has been consolidating for nearly two weeks.

The four-hour Bitcoin price chart reveals that $103K is a crucial level to watch. Whether Bitcoin experiences a rejection or a bounce here will indicate its next move.
If BTC breaks above the descending trendline resistance, confirming a breakout, the next target will be $107,000. Should a 4-hour candle close above this level, the current all-time high of $110K will become the key resistance level.
On the other hand, if Bitcoin fails to close above $103K, it could dip to the $100K to $98K range, where sidelined buyers might step in to accumulate. However, if selling pressure intensifies, Bitcoin could revisit the lower range around $92K.
However, In the last 24 hours, 132,959 traders were liquidated, totaling $291.68 million in liquidations. The largest single liquidation occurred on Binance with a BTCUSD_PERP order valued at $15.17M


Lokesh Gupta is a seasoned financial expert with 23 years of experience in Forex, Comex, NSE, MCX, NCDEX, and cryptocurrency markets. Investors have trusted his technical analysis skills so they may negotiate market swings and make wise investment selections. Lokesh merges his deep understanding of the market with his enthusiasm for teaching in his role as Content & Research Lead, producing informative pieces that give investors a leg up. In both conventional and cryptocurrency markets, he is a reliable adviser because of his strategic direction and ability to examine intricate market movements. Dedicated to study, market analysis, and investor education, Lokesh keeps abreast of the always-changing financial scene. His accurate and well-researched observations provide traders and investors with the tools they need to thrive in ever-changing market conditions.